Issue Brief: As Flu Season Ramps Up, Adults 18-64 Years Old Least Likely to Get Flu Shots
An analysis of flu vaccination rates and trends: only 35.7 percent of adults ages 18 to 64 years old got the flu shot last season. By comparison, 56.6 percent of children (ages 6 months to 17 years old) and 66.2 percent of seniors (ages 65 and older) were vaccinated.
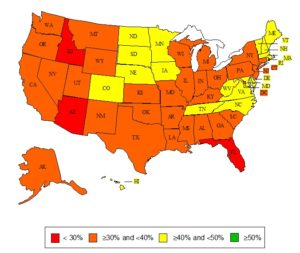
Analysis Finds 32 States Fail to Vaccinate at least 40 Percent of Adults 18-64 Years Old
An analysis by the Trust for America’s Health (TFAH) found that only 35.7 percent of adults ages 18 to 64 years old got the flu shot last season (the most recent period data with available data). By comparison, 56.6 percent of children (ages 6 months to 17 years old) and 66.2 percent of seniors (ages 65 and older) were vaccinated. The U.S. Centers for Disease Control and Prevention (CDC) recommends all American 6 months and older get vaccinated each year.
According to the CDC, the flu season in the United States is beginning to “ramp” up and flu is now widespread in 35 states. Rates are particularly high in 13 Southern and Central/Western states (Alabama, Arkansas, Indiana, Kansas, Louisiana, Mississippi, Missouri, Nevada, New Mexico, North Carolina, Oklahoma, Texas and Utah).
H1N1 is the most prevalent flu strain this season, which can disproportionately and adversely impact otherwise healthy children and young adults, according to the CDC.
“The trend of low vaccination rates among younger adults is particularly troubling this year, when they are more at risk than usual for the effects of the H1N1 strain of flu that’s circulating,” said Jeffrey Levi, PhD, executive director of TFAH.
Today’s analysis finds that overall flu vaccination rates remain low in the United States. Fewer than half of Americans (45 percent) got a flu shot during the 2012-13 season, which was an increase over 41.8 percent in the previous (2011-12) season.
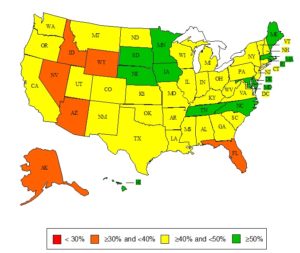
During the 2012-13 flu season, vaccination rates were highest in Massachusetts at 57.5 percent, and lowest in Florida at 34.1 percent. Only 12 states had vaccination rates of 50 percent or higher: Delaware, Hawaii, Iowa, Maine, Maryland, Massachusetts, Minnesota, Nebraska, North Carolina, Rhode Island, South Dakota and Tennessee.
There were only three states that had decreases in their vaccination rates from the 2011-12 to the 2012-13 season: Florida, Kansas and Wisconsin.
“It’s easy to become complacent about the flu. We’re used to it, it happens every year. So much so that we forget that it is largely preventable through a quick shot – which I might add is now free to most Americans thanks to the Affordable Care Act,” said Levi. “The flu isn’t just an uncomfortable inconvenience, it is deadly and costly. And millions of Americans do not even have paid sick leave, so they either go to work sick – infecting others – or do not get paid.”
The flu contributes to around $10.4 billion in direct healthcare costs and high worker absentee expenses. Each year, one in five – an average of 62 million – Americans get the flu. Between 3,000 and 49,000 Americans die (depending on the severity of the season), and 226,000 are hospitalized from the flu each year. Between 2004 and 2012, 830 children between 6 months and 18 years old died from flu complications; 43 percent of these children were completely healthy otherwise.
Yesterday, appropriations leaders from the U.S. Senate and House of Representatives announced an agreement on a Fiscal Year (FY) 2014 omnibus spending bill, The Consolidated Appropriations Act of 2014, which allocated $156.7 million for Influenza Planning and Response, about a $6.6 million increase over last year. However, it is still $2.2 million lower than what was appropriated in FY 2012. In addition, the Office of the Secretary of the U.S. Department of Health and Human Services was allocated $115 million for Pandemic Influenza Preparedness, which hadn’t been funded since FY 2011.
In December, TFAH and the Robert Wood Johnson Foundation (RWJF) issued the first edition of the Outbreaks: Protecting Americans from Infectious Diseases report, which found that a majority of states (33) scored 5 or lower out of 10 key indicators of policies and capabilities to protect against infectious disease threats – including the ability to prevent and control the flu. Three states tied for the lowest score, achieving two out of 10 possible indicators – Georgia, Nebraska and New Jersey. New Hampshire had the highest score at eight out of 10.
Some key actions TFAH recommends could be taken to improve flu vaccination rates and policies include:
- Increasing public education about the importance of getting vaccinated – and the safety of vaccines;
- Expanding support for immunization programs, making it easier and more convenient to get vaccinated;
- Supporting flu shots for all Americans without co-pays;
- Improving and modernizing surveillance and diagnostics;
- Requiring all healthcare personnel to receive the annual seasonal flu shot – to protect themselves and their patients;
- Requiring minimum sick leave benefits;
- Funding and incentivizing vaccine research; and
- Maintaining emergency flu and pandemic supplies in the Strategic National Stockpile.
Ranking for total percent of individuals (children and adults) ages 6 months and older vaccinated in the 2012-13 flu season (* indicates vaccination rates which decreased from the 2011-2012 flu year to the 2012-2013 flu season):

1. Massachusetts (57.5%); 2. TIE South Dakota and Rhode Island (56.7%); 4. Hawaii (54.3%); 5. Maryland (53.1%); 6. Minnesota (52.5%); 7. Delaware (51.3%); 8. Tennessee (50.8%); 9. Iowa (50.4%); 10. Nebraska (50.3%); 11. North Carolina (50.1%); 12. Maine (50.0%); 13. Vermont (49.6%); 14. Virginia (49.4%); 15. TIE New Hampshire and North Dakota (48.9%); 17. West Virginia (48.8%); 18. Colorado (48.3%); 19. New Mexico (48.1%); 20. Washington (47.5%); 21. District of Columbia (47.4%); 22. Louisiana (47.1%); 23. Arkansas (47.0%); 24. TIE Kentucky and New York (46.6%); 26. Connecticut (46.5%); 27, Missouri (46.4%); 28. Pennsylvania (46.2%); 29. Oklahoma (46.1%); 30. Alabama (45.7%); 31. New Jersey (45.3%); 32. TIE Ohio and South Carolina (44.8%); 34. California (44.2%); 35. Texas (43.7%); 36. Illinois (43.1%); 37. Utah (42.9%); 38. Indiana (42.4%); 39. Montana (41.7%); 40. Georgia (41.1%); 41. TIE Mississippi and Michigan (40.8%); 43. Kansas (40.7%)*; 44. Wisconsin (40.6%)*; 45. Oregon (40.1%); 46. Alaska (39.7%); 47. Nevada (39.6%); 48. Wyoming (39.2%); 49. Arizona (38.3%); 50. Idaho (37.8%); 51. Florida (34.1%)*
Ranking for total percent of adults ages 18 years to 64 years vaccinated in the 2012-13 flu season (* indicates vaccination rates which decreased from the 2011-2012 flu year to the 2012-2013 flu season):

1. Massachusetts (48.5%); 2. South Dakota (48.3%); 3. Minnesota (45.5%); 4. Rhode Island (44.9%); 5. Hawaii (44.2%); 6. Maryland (43.9%); 7. Iowa (43.3%); 8. Tennessee (42.6%); 9. North Carolina (42.1%); 10. Nebraska (41.8%); 11. Vermont (41.1%); 12. Virginia (40.8%)*; 13. Maine (40.6%); 14. Delaware (40.5%); 15. New Hampshire (40.3%); 16. TIE Colorado and North Dakota (40.1%); 18. West Virginia (40.0%); 19. Washington (39.3%); 20. Louisiana (38.8%); 21. Oklahoma (38.7%); 22. District of Columbia (38.5%)*; 23. TIE Alabama and Missouri (38.1%); 25. New Mexico (37.5%); 26. Arkansas (37.0%); 27. Utah (36.6%); 28. New York (36.5%); 29. Ohio (36.4%); 30. Kentucky (36.3%); 31. South Carolina (36.0%); 32. Pennsylvania (34.8%); 33. California (34.7%); 34. Illinois (34.6%); 35. Alaska (34.5%); 36. Connecticut (34.4%)*; 37. Montana (34.1%); 38. Texas (33.6%); 39. Kansas (33.4%)*; 40. New Jersey (33.1%); 41. Indiana (32.8%); 42. Georgia (32.7%); 43. Mississippi (32.6%). 44. TIE Nevada and Oregon (32.3%); 46. Michigan (32.2%); 47. Wisconsin (31.9%)*; 48. Wyoming (31.5%); 49. Idaho (29.8%); 50. Arizona (27.2%)*; 51. Florida (22.6%)*
Rankings are based on data from CDC’s FluVaxView data set.